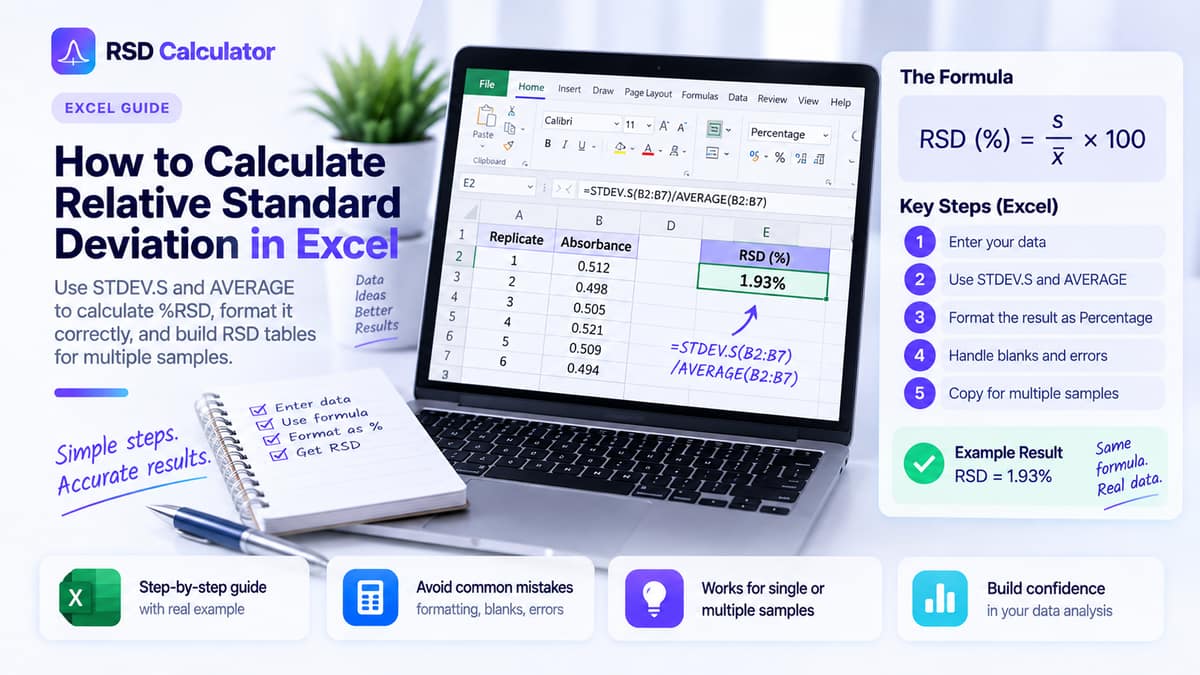
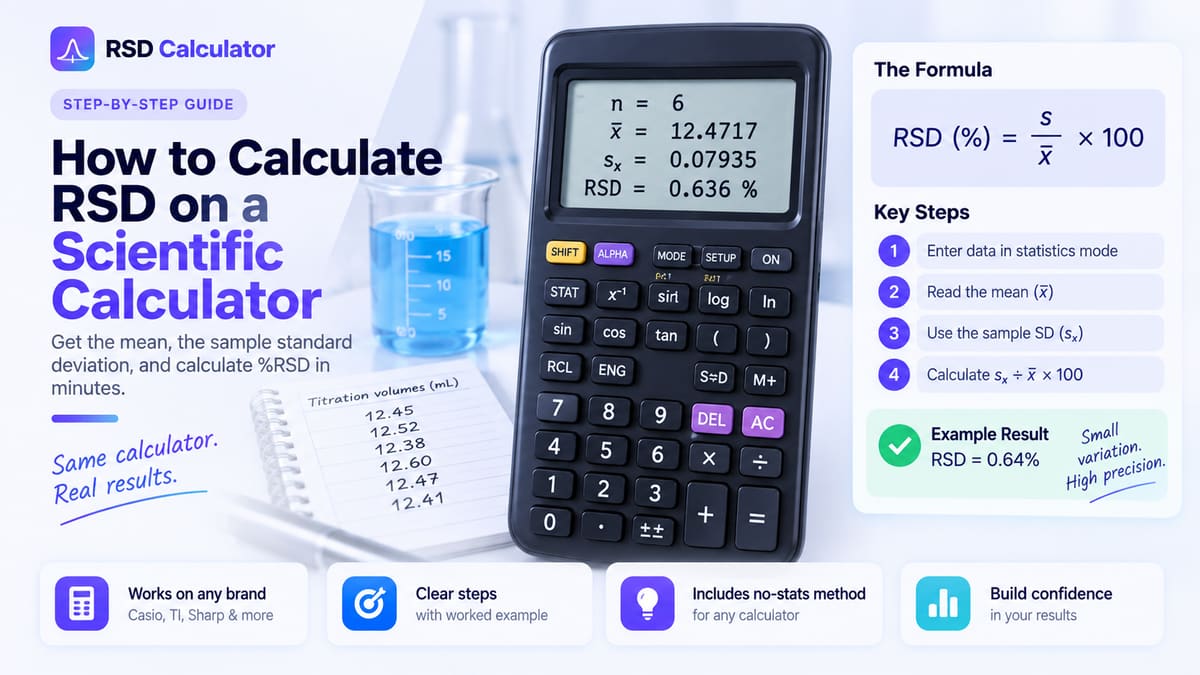
In HPLC, %RSD is the sample standard deviation of replicate injections divided by their mean, multiplied by 100. For peak area, six injections of 1245.8, 1251.3, 1248.1, 1239.6, 1253.7 and 1246.9 mAU·s give a mean of 1247.57, a standard deviation of 4.876 and an RSD of 0.39%. The same calculation on retention time measures how stable the elution is.
What counts as acceptable depends on the monograph or validated procedure, not on one universal number. This guide shows both calculations step by step, explains what USP <621> and related guidance actually say, and lists what a high RSD usually points to.
What %RSD Measures in HPLC
Replicate injections of the same reference solution test the chromatographic system: the autosampler, pump, column, detector and integration. Because the same solution is injected each time, sample preparation does not contribute. The 1994 FDA reviewer guidance on chromatographic methods makes this point directly: injection precision reflects the instrument and conditions, and “sample preparation and manufacturing variations are not considered.”
That makes injection RSD one level in a hierarchy of precision figures. Mixing them up is a common source of confusion.
| Precision level | What is replicated | What it includes |
|---|---|---|
| System (injection) repeatability | Injections of one solution | Instrument and integration only |
| Method repeatability | Independent sample preparations, one analyst, one run | Adds sample preparation |
| Intermediate precision | Preparations across days, analysts or instruments | Adds day-to-day and equipment variation |
| Reproducibility | Results from different laboratories | Adds between-laboratory differences |
This article is about the first level and its use in system suitability. The broader validation context is covered in Using RSD in Quality Control and Method Validation, and the higher levels are explained in Repeatability vs Reproducibility RSD.
The Formula Defined in USP <621>
The harmonized chromatography chapter, official in USP since 1 December 2022 and aligned with Ph. Eur. 2.2.46, defines system repeatability as the %RSD of a consecutive series of at least three injections of a reference solution:
Here yᵢ is each individual response, ȳ is their mean and n is the number of injections. The chapter allows the response to be peak area, peak height, or the ratio of areas when an internal standard is used.
The n − 1 divisor means this is the sample standard deviation. Using the population formula, which divides by n, gives a smaller number that will not match the pharmacopoeial result. For six injections the sample value is about 9.5% larger, because it is the population value multiplied by √(6/5). The sample vs population standard deviation guide explains why n − 1 is used for replicates.
Worked Example: Peak Area %RSD
Six replicate injections of a standard solution give these main-peak areas:
| Injection | Peak area (mAU·s) | Deviation from mean | Squared deviation |
|---|---|---|---|
| 1 | 1245.8 | −1.767 | 3.121 |
| 2 | 1251.3 | 3.733 | 13.938 |
| 3 | 1248.1 | 0.533 | 0.284 |
| 4 | 1239.6 | −7.967 | 63.468 |
| 5 | 1253.7 | 6.133 | 37.618 |
| 6 | 1246.9 | −0.667 | 0.444 |
| Total | 7485.4 | 0 | 118.873 |
- Mean: 7485.4 / 6 = 1247.567
- Sample variance: 118.873 / (6 − 1) = 23.775
- Sample standard deviation: √23.775 = 4.876
- %RSD: 4.876 / 1247.567 × 100 = 0.39%
The population formula would give 0.36%, which is why the divisor must be stated. Most chromatography data systems calculate this value automatically, but it is worth reproducing once by hand or in a spreadsheet so you know which formula your software applies.
Worked Example: Retention Time %RSD
The same six injections eluted at these retention times:
| Injection | Retention time (min) |
|---|---|
| 1 | 6.412 |
| 2 | 6.405 |
| 3 | 6.418 |
| 4 | 6.409 |
| 5 | 6.421 |
| 6 | 6.414 |
The mean is 6.4132 min, the sample standard deviation is 0.00585 min and the RSD is 0.091%. Converting to seconds changes nothing, because RSD has no units.
Retention time RSD is usually much smaller than peak area RSD. In this example the retention times span only 0.016 min. John Dolan, writing in LCGC, describes run-to-run variation of about ±0.02 to 0.05 min as typical and recommends judging it against the method’s own history (How Much Retention Time Variation Is Normal?).
No default retention time limit. The harmonized USP <621> text states that retention times and relative retentions in monographs are for information only unless the monograph says otherwise. The EDQM made the same point when the harmonized Ph. Eur. 2.2.46 was published. Internal limits on retention time RSD are common, but they are laboratory decisions, not pharmacopoeial requirements.
Retention time is still worth trending. A gradual shift over a sequence often shows up before peak areas become unreliable, and a sudden jump points to a hardware or mobile-phase problem.
Peak Area, Peak Height or Area Ratio?
USP <621> allows any of the three, and the procedure you follow should say which to use.
- Peak area is the usual choice. It is generally more precise than height when peaks are well resolved and reasonably symmetric.
- Peak height can be more accurate for partly resolved peaks. Michael Bicking’s LCGC analysis of integration errors found height measurements had an accuracy advantage when resolution was below about 1.5, while area measurements were often more reproducible for well-separated peaks (Integration Errors in Chromatographic Analysis).
- Area ratio to an internal standard corrects for injection volume variation, because both peaks are affected by the same injection. The RSD of the ratio is then often lower than the RSD of either raw area.
The response type also changes which faults show up. With UV detection, peak area depends strongly on flow rate while peak height depends on it only weakly, as Dwight Stoll explains in Effect of Flow Rate on UV Detection. A pump with unstable flow therefore degrades area precision more than height precision.
System Suitability: What the Limits Actually Say
Most confusion about HPLC RSD comes from quoting one number as if it applied everywhere. The sources below each apply in a specific context.
The monograph or procedure comes first
USP <621> states that when specific requirements are given in a monograph, they supersede the general chapter. A validated in-house procedure plays the same role for non-compendial methods. Always start there.
Number of injections (USP)
USP’s national text within <621> says that when a monograph specifies an RSD requirement, five replicate injections are used if the requirement is 2.0% or less, and six if it is more than 2.0%. This sentence is marked as USP-only text and is not part of the harmonized chapter shared with Ph. Eur.
The default for assays without a stated requirement
For an assay of an active substance or excipient where the target is 100% and the monograph gives no repeatability requirement, the harmonized text calculates the maximum permitted RSD from the assay limits:
K is a constant of 0.349, B is the upper limit of the assay definition minus 100%, n is the number of injections (3 to 6) and t is Student’s t at the 90% two-sided level with n − 1 degrees of freedom. The chapter tabulates the results:
| B (upper limit − 100%) | n = 3 | n = 4 | n = 5 | n = 6 |
|---|---|---|---|---|
| 2.0 | 0.41% | 0.59% | 0.73% | 0.85% |
| 2.5 | 0.52% | 0.74% | 0.92% | 1.06% |
| 3.0 | 0.62% | 0.89% | 1.10% | 1.27% |
For a substance defined as 98.0% to 102.0%, B = 2.0. With six injections, the maximum RSD is 0.349 × 2.0 × √6 / 2.015 = 0.85%. The worked peak-area example above, at 0.39%, would pass. Notice that the limit depends on n, so an RSD from three injections must be compared with a tighter value than one from six.
To see the effect, take only the first five injections of the worked example: 1245.8, 1251.3, 1248.1, 1239.6 and 1253.7. Their mean is 1247.70, the sample standard deviation is 5.439 and the RSD is 0.44%. For n = 5 and B = 2.0 the table gives a limit of 0.73%, so this subset also passes, but against a tighter limit than the six-injection value of 0.85%. Fewer injections give a less certain RSD, and the formula compensates by demanding a smaller one.
Other published figures, in context
| Source | Figure | Context |
|---|---|---|
| FDA CDER Reviewer Guidance, November 1994 | RSD ≤ 1% for n ≥ 5 described as “desirable” | Reviewer guidance for injection repeatability; it adds that higher variation may be acceptable for low-level impurities |
| ICH Q2(R2), 2023 | No numeric limit | Sets the design for method repeatability (at least 6 determinations at 100%, or 9 across the range) and asks for SD, RSD and a confidence interval |
| ICH Q14, 2023 | Example of ≤ 5% injection repeatability at a 0.5% impurity level | An illustrative example in an annex, not a requirement |
| ICH M10, 2022 | CV ≤ 15%, or ≤ 20% at the LLOQ | Bioanalytical QC concentrations across a run, not injection repeatability |
Many monographs specify 2.0% for standard injections, and many laboratories apply tighter internal limits for modern equipment. Both are legitimate in their context. Neither is a universal HPLC rule.
How Reliable Is an RSD From Five or Six Injections?
Very few injections go into a system suitability RSD, so the value itself is uncertain. A standard 95% confidence interval for a standard deviation estimated from six values runs from about 0.62 to 2.45 times the observed value. For five values it runs from about 0.60 to 2.87 times.
In practice, an observed RSD of 0.50% from six injections is consistent with a true injection precision anywhere from about 0.31% to 1.23%. That is one reason ICH Q2(R2) asks for a confidence interval alongside the RSD in validation, and why a single borderline result deserves a look at the trend rather than an immediate conclusion.
Trending is simple to set up. Record the system suitability RSD from every sequence in a spreadsheet or control chart, together with the instrument, column and date. A gradual upward drift over several weeks usually points to wear, such as an injector seal or pump check valve, long before a single sequence fails. A jump that coincides with a new column, mobile phase batch or maintenance visit tells you where to look first.
What a High RSD Usually Points To
The pattern of symptoms narrows down the cause. The table draws on troubleshooting guidance from LCGC columns by Dolan and Stoll and on the FDA reviewer guidance.
| Symptom | Likely causes |
|---|---|
| Peak area RSD high, retention time stable | Air bubbles drawn into the needle or syringe, partly blocked needle, worn injector seal or septum fragments, carryover from the previous injection |
| Peak area and retention time both variable | Pump flow instability (check valves, air in a pump head), a leak in the flow path |
| Retention time drifting in one direction | Mobile phase composition change, column temperature not controlled, insufficient re-equilibration between gradient runs |
| High area RSD only for small peaks | Integration limited by baseline noise near the quantification limit |
| One injection far from the rest | A single injection fault, such as an air bubble or a sampling error |
The last row is worth illustrating. If injection 4 in the worked example had read 1198.4 instead of 1239.6, the RSD would jump from 0.39% to 1.69%. Do not simply delete the injection. Investigate it, document the cause, and follow your laboratory’s rules for invalidating a result.
For small peaks, Dolan gives a useful rule of thumb in Locating Precision Problems: the imprecision caused by integration noise is roughly 50 divided by the signal-to-noise ratio. A peak with S/N = 10 therefore carries about 5% RSD from noise alone, while S/N = 100 contributes about 0.5%. That is why injection RSD limits are usually wider for impurities near the reporting threshold than for the main peak.
In a separate column on autosampler performance, Dolan suggests that a replicate-injection check of more than about 1% RSD on a simple test solution indicates the autosampler needs service, while many autosamplers achieve 0.3% to 0.5%.
Common Mistakes
- Using the population standard deviation. It understates RSD. The pharmacopoeial formula uses n − 1.
- Mixing solutions. Injections from different vials or different preparations measure method precision, not system repeatability.
- Comparing RSDs from different numbers of injections with one limit. The harmonized default limit tightens as n falls.
- Quoting a limit without its source. “2%” might come from a monograph, an SOP or habit. State which.
- Rounding early. Rounding areas to whole numbers before calculating can shift a small RSD noticeably. Round only the final result.
- Ignoring retention time. A retention time trend is often the first sign of a pump or mobile phase problem that will soon affect peak areas.
- Over-reading one value. An RSD from six injections has a wide confidence interval. Trend results over time before drawing conclusions about the system.
Limits of RSD in Chromatography
RSD tells you how closely replicate responses agree. It says nothing about whether the response is correct. A system can inject very precisely while an integration setting cuts off part of a peak, or while a standard is prepared at the wrong concentration. Accuracy needs separate checks, such as recovery or comparison with a reference standard.
RSD also becomes unstable for very small responses. For peaks near the limit of quantification, the mean area is small relative to baseline noise, so RSD rises steeply and can vary a lot between runs. That is expected behaviour, not necessarily a fault. For between-laboratory precision at different concentration levels, the Horwitz equation describes how relative precision typically changes with concentration.
Check Your Numbers
Enter the six peak areas or retention times into the RSD Calculator with the Sample (n − 1) option selected. It returns the mean, standard deviation and %RSD, so you can confirm that your chromatography data system uses the same formula as the pharmacopoeia.
Frequently Asked Questions
What is an acceptable %RSD for HPLC system suitability?
There is no single universal value. The monograph or validated procedure sets the limit. For assays where no requirement is stated, the harmonized USP <621> and Ph. Eur. 2.2.46 text calculates a maximum RSD from the assay limits and the number of injections, for example 0.85% for six injections when the upper limit is 102.0%. Many monographs state 2.0%, and a 1994 FDA reviewer guidance described 1% or less for five or more injections as desirable.
How many replicate injections are needed for an RSD system suitability test?
USP <621> defines system repeatability using at least three injections. Where a monograph states an RSD requirement, USP's national text specifies five replicate injections if the limit is 2.0% or less and six if it is above 2.0%. The procedure you are following may specify a different number.
Is there an acceptance limit for retention time RSD?
Not by default. Both USP <621> and Ph. Eur. 2.2.46 state that retention times in monographs are given for information only unless the monograph says otherwise. Laboratories often trend retention time or set internal limits, but those are local choices rather than pharmacopoeial requirements.
Should HPLC %RSD use n or n − 1?
Use n − 1. The system repeatability formula in USP <621> divides the sum of squared deviations by n − 1, which is the sample standard deviation. Using n gives a smaller RSD that does not match the pharmacopoeial calculation.
Why is my peak area RSD high when retention time is stable?
When retention time is steady, the pump and mobile phase are usually fine, so the problem is more often in the injection or integration. Common causes are air bubbles in the sample path, a partly blocked needle, a worn injector seal, carryover, or integration of a small peak close to the baseline noise.